Anthropometry For Assessment Of Nutritional Status
Growth and neuromotor development are the most distinctive attributes of children which distinguish them from adults.
Table of Contents
- The anatomical characteristics and functional maturity of various organs at different ages affect the incidence and manifestations of diseases in children and childhood disorders can adversely affect the growth and development of children.
- Protein-energy malnutrition is the core health problem in children which makes them vulnerable to developing a variety of infectious diseases perpetuating a vicious cycle of disease and debility.
Read and Learn More Pediatric Clinical Methods Notes
Corrected Age
In prematurely born babies, corrected or conceptual age should be used for assessment of growth and development.
For example, if a child is born on April 2, 1999, while his expected date of delivery was June 2, 1999, this means his gestational age at birth was 32 weeks.
- He will be zero days old on June 2, 1999. Therefore, the corrected post-natal age of this child on August 2, would be only 2 months (not 4 months).
- His physical growth and mental development on August 2, 1999, would correspond to a normal 2-month-old child.
- The concept of corrected age is used for assessment of growth and development at least during the first year of life.
Corrected Age Weight
The measurement of weight is a simple and reliable criterion for the assessment of the health and nutritional status of children.
- Birth weight depends upon the health, nutrition, and well-being of the mother during pregnancy.
- The physical growth after birth depends upon the interaction between genetic endowment and environmental influences, especially dietary intake and the occurrence or absence of infectious diseases.
- Weight is a measure of total body mass and is sensitive to changes in body fluids, fat, muscle mass, skeleton, and body organs.
- The weight can be recorded on a beam-type weighing scale (Detecto scale with an accuracy of ±20 g). The scale should be frequently calibrated with standard weights and zero error must be adjusted before weighing.
- Electronic weighing scales for infants (±5–10 g) and children (±100 g) are available and should be preferred for their accuracy and convenience.
- It is ideal to record nude weight in infants but in clinical practice, it is acceptable and convenient to record weight with minimal or identical clothes each time.
- The bathroom type of mechanical scale is unreliable for monitoring the weight of children and should not be used. In field conditions, the Salter spring machine is quite satisfactory because it is convenient to carry.
- The balance is hung from a hook or held by an attendant and the baby is placed on the sling attached to the bottom hook.
The periodic weight record on a Road-to-Health chart is essential for monitoring the growth of under-5 children


The child is being weighed on an electronic weighing scale (range 10–100 kg) with a resolution of ±100 g. Zero reading is obtained by pressing the tare knob.
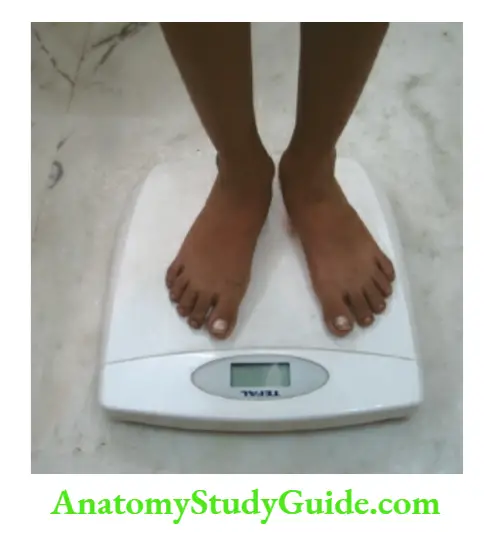
Weighing the child on an electronic digital readout type of weighing scale with a resolution of ±100 g.

Spring balance with a hamper sling for recording the weight of neonates and infants by community health workers.
- The National Center for Health Statistics (NCHS) and WHO reference data and growth charts are recommended for use throughout the world for the sake of uniformity.
- However, the use of a single international reference standard assumes that all children have identical genetic potential for growth which is not true.
- It would, therefore, be more logical to use reference growth charts prepared by healthy Indian children belonging to the higher socioeconomic groups without any developmental, environmental, or nutritional constraints.
- The isolated weight record does not provide any information regarding growth velocity or pattern of growth. The average growth velocity during childhood is shown in.
- The boys generally weigh more than the girls up to the age of 12 years. During 12 to 14 years, the girls weigh more than the boys because of early pubertal growth spurt.
Depending upon the actual weight of the child, weightage should be expressed by consulting the standard growth chart
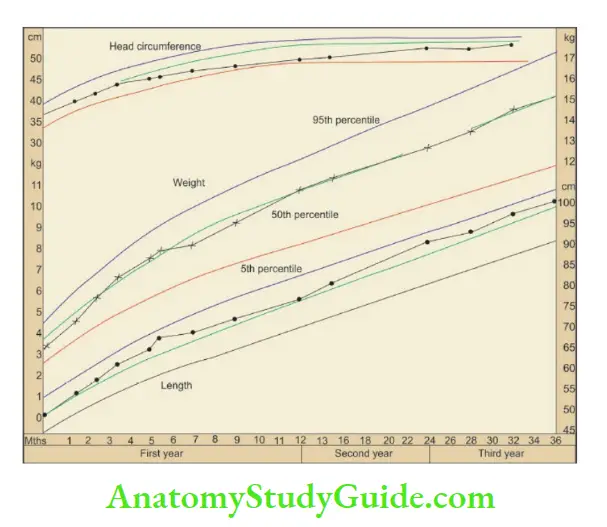
Road-to-Health card for monitoring the growth of under-five children. It is recommended to record growth parameters once a month (during visits for vaccinations) during the first year, every 2 months during the second year, and every 3 months subsequently.
- The card also gives simple messages for immunizations, feeding, and developmental milestones on the reverse.
- The mother should be explained the importance of growth monitoring and given the responsibility to keep the card in her safe custody.
- The periodic weight record provides valuable information regarding the growth velocity of the child as opposed to an isolated weight record.
- The trend or slope of the weight curve is more important than its location on the chart. The satisfactory growth curve is directed upward and lies parallel to the thick lines on the chart.
- If the growth curve is flat or directed downward, the child needs urgent attention to identify the cause and reverse the trend.
- During early infancy, weight gain depends upon the gestational age, birth weight, health and well-being of the mother, and adequacy of breastfeeding.
- By 1 to 2 years of age, most children would find their constitutional or genetic growth curve and maintain their growth velocity along their genetically appropriate growth curve.
The growth chart serves as a useful tool to promote nutrition education and interaction between the health worker and the mother.
Growth velocity
1. 0–4 months
5–8 months
9–12 months
1–3 years
4–12 years
Adolescence
Girls 12–16 years
Boys 14–18 years
2. Weight at 4–5 months
Weight at 1 year
Weight at 2 years
Weight at 7 years
3. Weight in kg = (Age in years + 3) × 2.3
1.0 kg/month (30 g/day)
0.75 kg/month (20 g/day)
0.50 kg/month (15 g/day)
3.0 kg/yr
2.0 kg/yr
3.0–4.0 kg/yr
6.0–7.0 kg/yr
2 × birth weight
4 × birth weight
7 × birth weight
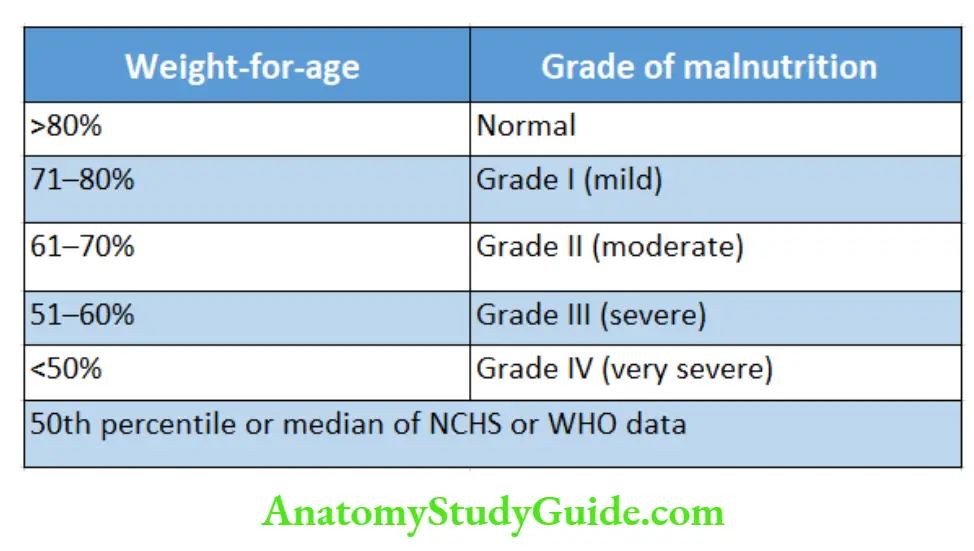
The weight-for-age is a reliable index of the nutritional status of a child. The IAP classification of malnutrition based on weight-for-age is given in.
Length Or Height
Up to 2 years of age recumbent length is measured with the help of an infantometer while in older children standing height or stature is recorded.
- Accurate recording of length is difficult and often unreliable although it is a better index of physical growth. The infant is placed supine on the infantometer.
- The assistant or mother is asked to keep the vertex or top of the head snugly touching the fixed vertical plank so that the external auditory meatus and lower margins of orbits are aligned perpendicular to the table.
- The legs are fully extended by pressing over the knees, and feet are kept vertical at 90°, the movable pedal plank of the infants-met is snuggly apposed against the soles, and length is read from the scale to the nearest 0.1 cm.
- In practice, it is difficult to extend both legs but it is convenient and satisfactory to extend only one leg to record the length.
It is more convenient to externally rotate the leg because complete extension at the knee is not possible due to physiological hypertonia in infants.

In older children who can stand, height can be measured by the rod attached to the lever-type machine or by a stadiometer, or simply by making the child stand against a wall on which a measuring scale is inscribed.
- The child should stand with bare feet on a flat floor against a wall with feet parallel and with heels, buttocks, shoulders, and occiput touching the wall.
- The head should be held erect with eyes aligned horizontally and ears vertically without any tilt. The child should be asked to stand erect and try to make himself “as tall as possible” without lifting the heels from the ground.
- With the help of a wooden spatula or plastic ruler, the topmost point of the vertex is identified on the wall.
- It is convenient to use an in-built stadiometer affixed to the wall which provides a direct read-out of height with an accuracy of +0.1 cm.
- The linear growth (stature or height) ceases after the fusion of epiphyses when puberty or sexual maturation is achieved.
However, several body organs and tissues, like hair, skin, nails, the lining of the gastrointestinal tract, and immune cells, go through a continuous process of degeneration, regeneration, and growth throughout life.

Nutritional deprivation over some time (generally over 6 months) affects the stature or linear growth of the child while acute starvation is associated with weight loss due to wasting or loss of subcutaneous tissue and muscle mass.
Depending upon the actual height of the child, the height age should be expressed by consulting the standard height chart. The average length or height velocity during childhood is shown in.
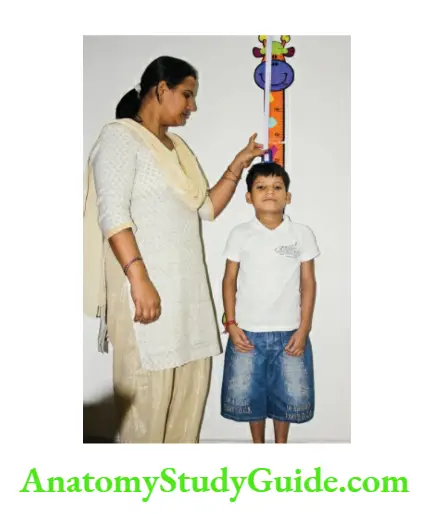
Method of recording height with a stadiometer. Note the erect posture with perfect alignment of the eyes and ears of the child.
Length or height velocity
At birth
Gain during 1st year
Gain during 2nd year
Gain during 3rd year
Gain during 3–12 years
Adolescence
Girls 12–16 years
Boys 14–18 years
8 cm/year
10 cm/year
20 inches (50 cm)
10 inches (25 cm)
5 inches (12.5 cm)
3–4 inches (7.5–10 cm)
2–3 inches/year (5.0–7.5 cm)
During a period of observation of at least 6 months, if the growth velocity is less than 5 cm per year after the age of 4 years, it is suggestive of growth failure or poor linear growth.
- During adolescence, 20% of body stature and 50% of adult bone mass is laid down. Adolescent growth spurt continues for a period of 2.5 to 3.0 years and occurs mostly during the sexual maturity stages 2–5.
- In girls, adolescent growth spurt becomes minimal or stops after the onset of menstruation while it continues up to 18 years in boys. Adolescent growth is more in boys as compared to girls for all body measurements except hip width.
Calculation of expected height up to 12 years
Length or height (inches)
= Age in years × 2.5 + 30
= Age in Length or height (cm)
years × 6 + 77
Prediction of adult height
1. The calculation of mid-parental height is useful to evaluate the child’s genetic endowment for linear growth. The determination is made by using the following formulae:
Boys = (Mother’s height in cm) + (Father’s height in cm)/2 + 6.5 cm
Girls = (Mother’s height in cm) + (Father’s height in cm)/2–6.5 cm
The projected target height by this method corresponds to within ±6 cm or ±2 SD. This represents the 3rd and 97th percentile for the child.
2. Tanner’s formula
Adult height = height at 2 years × 2
Adult height = height at 3 years × 1.37
3. Weech’s formula for Adult height in inches
Boys = 0.545 H3 + 0.544 P + 14.84
Girls = 0.545 H 3 + 0.544 P + 10.09
wherein H 3 is the height of the child at 3 years and P refers to the mean height of the parents. This calculation is based on the assumption that height at 3 years is a good predictor of ultimate adult height.
Head Circumference
During fetal life, almost 60 to 70% of brain growth takes place. During infancy, 15% of brain growth occurs while the remaining 10% of brain growth takes place during preschool years.
- If scalp edema or cranial molding is present, measurement of head circumference may be inaccurate until the third or fourth day of life. Head circumference is routinely recorded up to 5 years of age.
- Marasmic children are seen to have relatively large heads for their body size because brain growth is minimally affected by malnutrition.
- During states of undernutrition of varying severity, weight (subcutaneous fat and muscles), linear growth (height), and brain growth are affected in that order.
- The occipitofrontal head circumference (OFC) should be measured with a narrow non-stretchable fiberglass tape.
- The tape should encircle over the most prominent parts of the occiput and supraorbital frontal areas with sufficient pressure to compress the hair and OFC recorded to the nearest 0.1 cm.
- depicts the normal range of head circumference in under-five children. The head circumference growth velocity in under-5 children is shown in.
The term macrocephaly refers to the occipitofrontal circumference of more than 2 SD above the mean while microcephaly is diagnosed when OFC is more than 2 SD below the mean for age, sex, height, and weight.
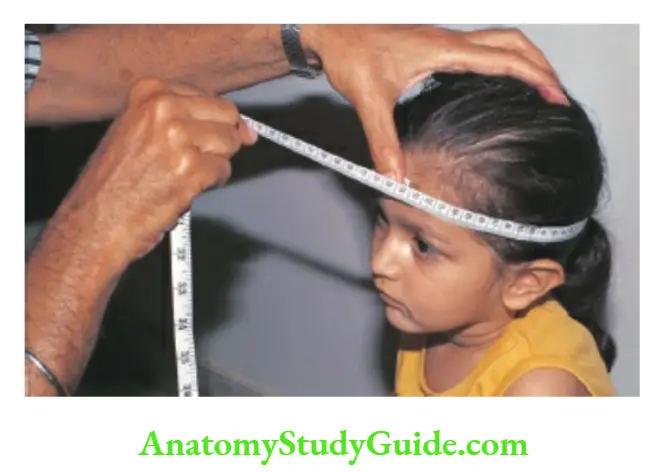
Method for recording head circumference. Use a non-stretchable fiberglass tape and encircle the most prominent parts of the occiput and supraorbital ridges.
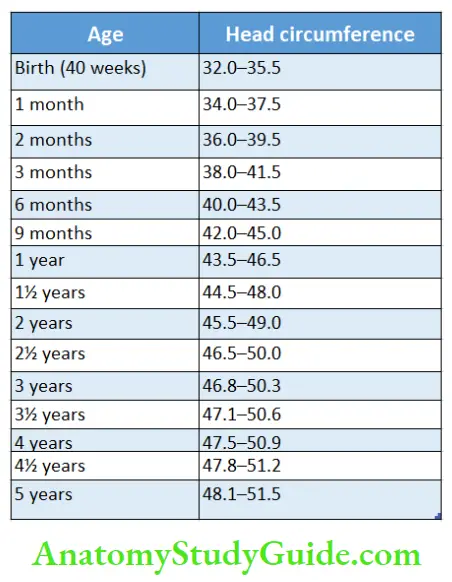
Head circumference growth velocity
First 3 months
3 months-1 year
1–3 years
3–5 years
2 cm/month
2 cm/3 months (1/3rd of initial velocity)
1 cm/6 months (1/12th of initial velocity)
1 cm/year (1/24th of initial velocity)
During the first year, there is a 12 cm increase in head circumference, while between 1 and 5 years of age, only a 5 cm gain occurs in head size. Adult head size varies between 55 and 56 cm.
- At birth, skull bones are separated by gaps or sutures and soft spots or fontanels to facilitate the growth of the brain.
- There are a total of six fontanels, one anterior, one posterior, and four lateral, two on each side of the skull (anterolateral and posterolateral).
- The lateral fontanels are usually closed at birth while the posterior fontanel closes by 3 months of age. The anterior fontanel usually closes by the age of 10–18 months.
Relationship Between Head Size With Chest Circumference
At birth, head circumference is larger by up to 3 cm as compared to chest circumference.
- The head circumference is larger by more than 3 cm as compared to the chest circumference at birth in preterms, small-for-dates, and hydrocephalic infants.
- The chest circumference equals head circumference around 9 months to 1 year of age and subsequently chest grows more rapidly as compared to the brain.
- In preterm babies, chest circumference may exceed head circumference between 6 and 9 months of age.
- In malnourished children, chest size may be significantly smaller than the head circumference because the growth of the brain is less affected by undernutrition.
- Therefore, there will be considerable delay before chest circumference overtakes head circumference. The chest circumference is measured at the level of the nipples.
Some workers recommend measurement of the chest circumference at the level of the xiphisternal junction because the location of the nipples may be variable.

Age-Independent Criteria For Assessment Of Nutritional Status
In developing countries, the date of birth and hence accurate age of the child is often unknown thus invalidating the above referred age-dependent parameters.
- The rough age may be deduced by using a local calendar of events, seasons, and festivals.
- In case the mother is ignorant about the age of the child, the following age-independent parameters can be utilized to assess the nutritional status of the child.
Mid-upper Arm Circumference
During 1–5 years of age, the mid-upper arm circumference (MUAC) remains reasonably static between 15 and 17 cm among healthy children because the fat of early infancy is gradually replaced by muscles.
- It is conventionally measured over the left upper arm. A point is marked over the anterior surface of the arm, midway between the acromion (shoulder) and the olecranon (elbow) with the arm bent at a right angle.
- The child is asked to stand or sit with the arm hanging loose at the side.
- Mid-upper arm circumference is measured with fiberglass or steel tape at the midpoint between the acromial and olecranon.
- The tailor’s tape is not accurate and should not be used. If the circumference of the upper arm is less than 12.5 cm, it is suggestive of severe malnutrition while MUAC between 12.5 and 13.5 cm is indicative of moderate malnutrition.

1 and 2 Method for recording mid-upper arm circumference. 1 Midpoint between acromion and olecranon is identified. 2 The circumference is measured with the help of a fiberglass tape. The measurement should be taken only in children between the ages of 1 and 5 years.
- The bangle test can be used for quick assessment of arm circumference. A fiberglass ring of internal diameter of 4 cm is slipped up the arm.
- If it passes above the elbow, it suggests that the upper arm is less than 12.5 cm and the child is malnourished.
- Shakir tape is a fiber-glass tape with red (less than 12.5 cm), yellow (12.5–13.5 cm), and green (>13.5 cm) color codes so that paramedical workers can assess nutritional status without having to remember the normal limits of mid-upper arm circumference.
Quac Stick
It is developed on the principle that acute starvation severely affects mid-upper arm circumference while height is unaffected.
- The child appears tall, thin, and wasted. The Quac stick is a meter rod with two sets of markings.
- The expected height of the child against various sizes of mid-upper arm circumference of children between 1 and 5 years is inscribed on the rod.
- The malnourished child would be taller than the anticipated height derived from the mid-upper arm circumference.
The thickness of Subcutaneous Fat
The subcutaneous fat thickness is measured with Harpenden or Lange caliper over the triceps, subscapular, or supra iliac region.
- The skin fold with subcutaneous fat is picked with the left thumb and index finger, and a caliper is applied beyond the pinch.
- The fat thickness is 10 mm or more among healthy children between 1 and 6 years of age.
If it is less than 6 mm it is indicative of a moderate to severe degree of malnutrition. This method is cumbersome and mostly used in research protocols.
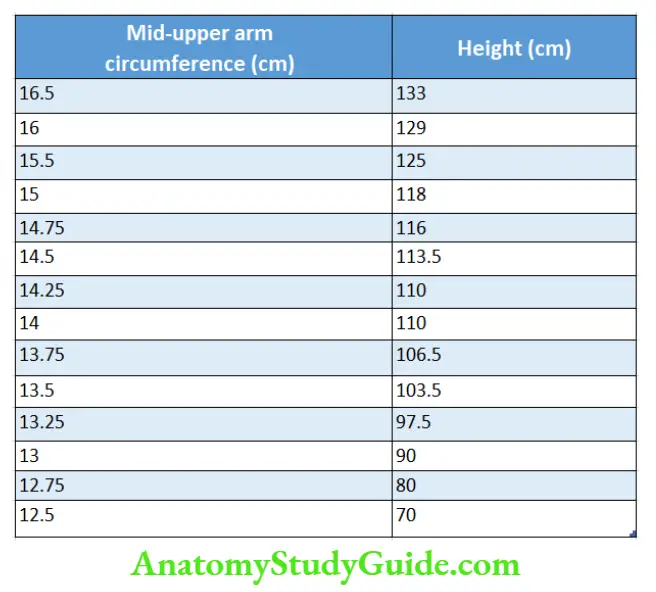
Body Ratios
They are complicated and often unreliable.
Rao and Singh’s weight-height index
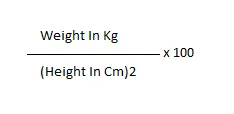
Kanwati and McLaren index (during 3 months to 4 years)

The normal ratio is more than 0.31 while a ratio of less than 0.25 suggests severe malnutrition.
Weight-for-Height
Weight-for-height is expressed as a percentage of the reference median weight expected based on the height of the patient and is calculated as follows

The nutritional status can be expressed as follows based on weight for height:
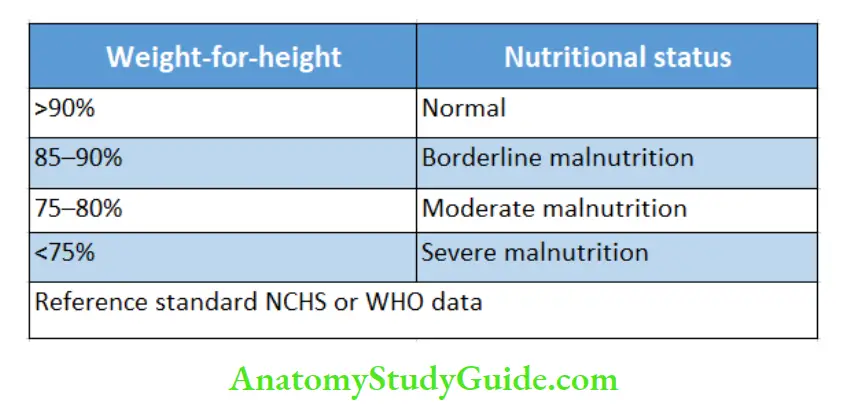
Weight-For-Height And Height-For-Age Classification
When malnutrition has been chronic, the child is “stunted”, both his weight-for-age and height-for-age are low but his weight-for-height is usually normal.
In acute malnutrition, however, the height-for-age is appropriate but the child is “wasted” and underweight for his age. Based on the dynamics of malnutrition, there are various classifications of protein-energy malnutrition.
Body Mass Index (BMI)
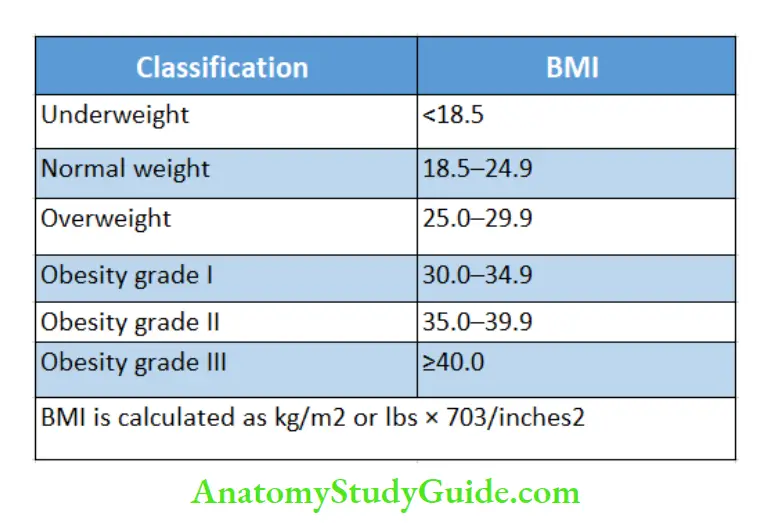
Body mass index is considered a better criterion for the diagnosis of overweight and obesity because it expresses body weight concerning height.
- It is calculated as weight in kg/(height in meters)2. BMI can also be calculated by another mathematical formula, i.e. weight in pounds/(height in inches)2 × 703.
- BMI-for-age percentile charts are available which can be used to diagnose obesity.
- A BMI-for-age of >85th percentile is suggestive of overweight and when it is more than 95th percentile for age and sex or when it is associated with triceps or subscapular skin fold thickness-for-age of >90th percentile, it is diagnostic of obesity.
- WHO has proposed a simplified classification of nutritional status based on body mass index.
- BMI alone may not provide a reliable estimate of obesity among bodybuilders and adolescents who have excessive lean body weight because of good muscle mass and heavy bones.
- Body volume index (BVI) is now considered a more reliable parameter of obesity, but it demands the availability of a special three-dimensional full-body scanner to accurately assess both the quantum as well as the distribution of fat in the body.
- Body volume index provides computer-based data on BMI, waist circumference, and waist-to-hip ratio.
- Waist circumference or waist-to-hip ratios alone can be used which are good correlates of increased risk for type 2 diabetes mellitus and cardiovascular disease.
- In general, Indians have a greater amount of visceral and abdominal fat compared to the Western population. Waist circumference is measured just above the level of iliac crests.
In adults, a waist-to-hip ratio of more than 0.9 in women and >1.0 in men is considered abnormal. Various classifications of protein-energy malnutrition are summarized.
Ponderal index (PI) is another parameter that is similar to BMI and is used for defining newborn babies with intrauterine growth retardation.
The ponderal index is calculated by the formula Body weight in grams/length (cm)3 × 100. In malnourished small-for-dates babies (asymmetric IUGR), the ponderal index is less than 2.0 while it is usually more than 2.5 in term-appropriate-gestation babies and hypoplastic SFD babies.
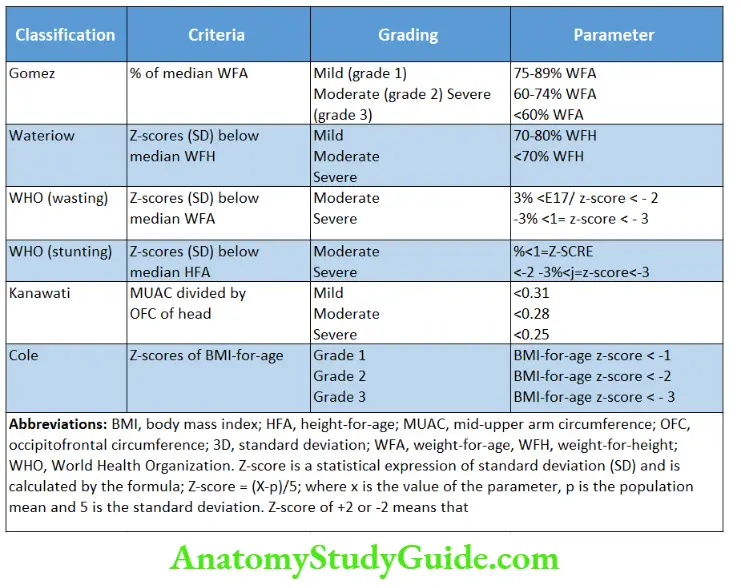
Proportional Trunk And Limb Growth
The midpoint of the body in the newborn is at the umbilicus whereas in an adult the midpoint shifts to the symphysis pubis due to greater growth of limbs than the trunk.
- The upper segment (vertex to the upper edge of the symphysis pubis) to the lower segment (limb length, symphysis pubis to heels) ratio at birth is 1.8 to 1.0.
- There is a gradual reduction in the ratio (due to rapid epiphyseal or limb growth) by 0.07–0.10 every year till the ratio is around 1:0 to 1:0 at 10–12 years.
- Among healthy adults, the usual trunk-to-limb ratio is 1.0 to 1.1. In infants, the upper segment (crown to symphysis pubis) can be measured by using an infantometer as shown in.
- The lower segment is obtained by subtracting the upper segment from the total length.
In older children, the lower segment can be measured from the symphysis pubis to the floor when a child is standing and the upper segment is deduced by subtracting the lower segment from the height.

Infantile upper-segment to lower-segment ratio (trunk abnormally large or limbs abnormally small) is seen in achondroplasia, cretinism, short-limbed dwarfism, sexual precocity, and bowed legs while advanced upper-segment-to-lower-segment ratio (trunk abnormally short or limbs abnormally long) is seen in arachnodactyly, hypogonadism, eunuchoidism, Turner syndrome, Klinefelter syndrome, chondrodystrophy, and spinal deformities (rickets, Pott’s spine).
Arm Span
- It is the distance between the tips of the middle fingers of both arms outstretched at right angles to the body with palms facing forward.
- The arm span is measured across the back of the child. In under-5 children, the span is 1 to 2 cm smaller than the body length. During 10–12 years of age, the span is equal to the height while in adults span is more than the height by 2 cm.
- Abnormally large span is seen in patients with arachnodactyly, (Marfan syndrome), eunuchoidism, Klinefelter syndrome, and coarctation of the aorta (due to relative overgrowth of upper extremities).
Arm span is short as compared to height in patients with short-limbed dwarfism, cretinism, and achondroplasia.
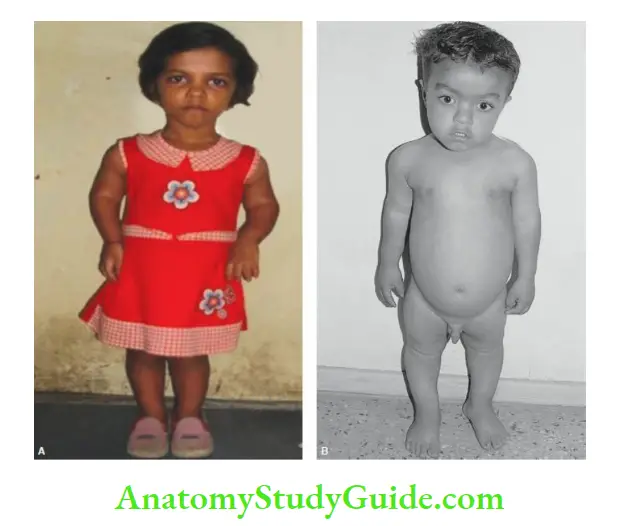
A and B Achondroplasia. The upper segment is normal while the limbs are short producing an infantile upper-to-lower body segment ratio. The hands barely reach the thighs.
Obesity
Protein-energy malnutrition is indeed a public health problem or a core health problem in children in developing countries.
- Nevertheless, overnutrition or obesity is being increasingly recognized in children belonging to affluent families having unhealthy dietary practices (intake of calorie-dense snacks and junk food) and sedentary lifestyles.
- Almost 25% of adolescent children attending private schools are obese. There is no satisfactory or standard definition for obesity in children.
- A weight-for-height of greater than 2 SD of NCHS or WHO data (> + 2 Z scores) or above the 95th percentile is suggestive of obesity. The WHO expert committee recommends the use of body mass index for age.
- A BMI-for-age of >85th percentile is suggestive of overweight but when it is more than 95th percentile, it is diagnostic of adolescent obesity.
- BMI alone may not provide a reliable estimate of obesity among bodybuilders and adolescents with good muscle mass and heavy bones.
- Constitutional or nutritional obesity should be differentiated from pathological or endocrinal obesity. Pathological obesity during infancy is easy to diagnose and is often due to endocrinal causes or known syndromes.
Apart from adverse psychological effects and orthopedic complications, obesity is a recognized risk factor for non-insulin-dependent type 2 diabetes mellitus, hypertension, coronary artery disease, osteoporosis, and the development of some cancers in adulthood.
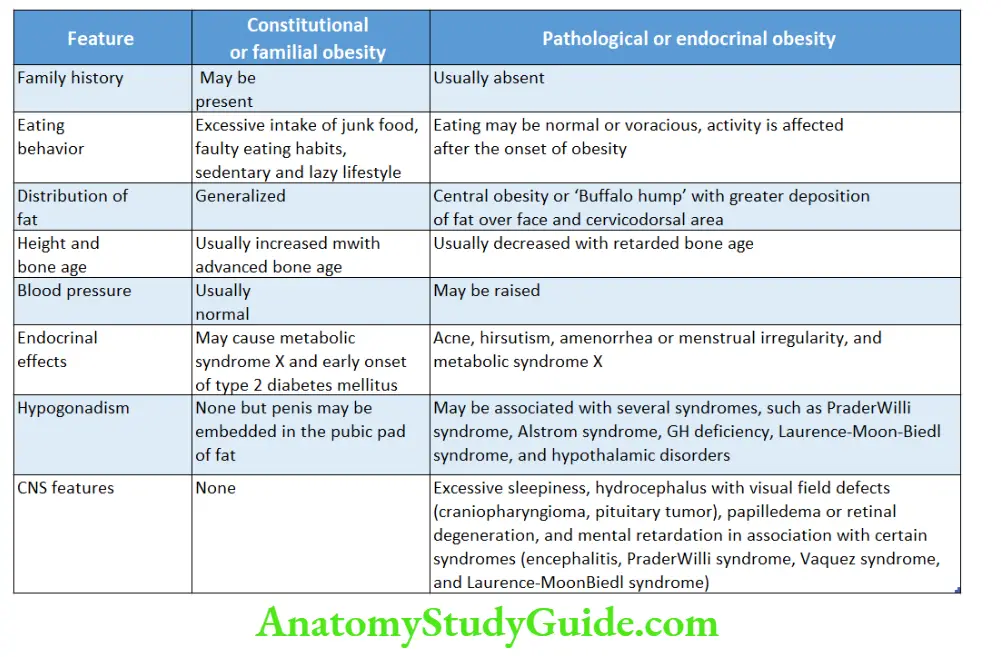
Endogenous or pathological obesity is uncommon and occurs due to genetic and endocrinal causes. The clinical features of pathological obesity due to various genetic and hormonal causes are listed.

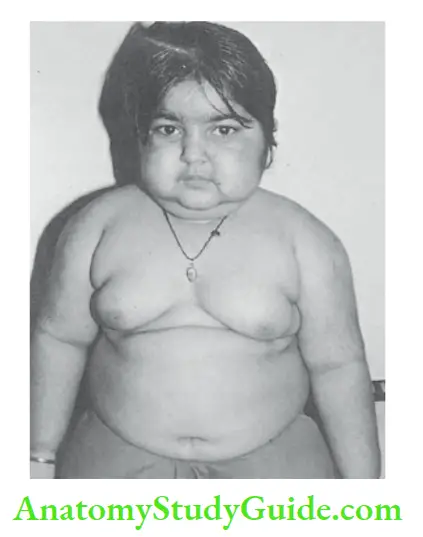
A 3-year-old girl with obesity due to Cushing’s syndrome as a result of carcinoma of the adrenal cortex. Note moon facies, double chin, hirsutism, buffalo hump with enlarged overhanging breasts.

Leave a Reply